
 线上的接口响应时间太长,怎么排查?
# Arthas 简介
Arthas是阿里开源的一款 Java 诊断工具,可以在无需重启 JVM 的情况下,实时查看应用 load、内存、gc、线程等状态信息,还能实时查看方法调用入参、出参、方法调用耗时等
# Arthas 快速开始
直接下载Arthasjar 包,然后用java -jar命令启动即可
$ curl -O https://arthas.aliyun.com/arthas-boot.jar
$ java -jar arthas-boot.jar
1
2
2
Arthas启动的时候,会打印出当前运行的 java 进程
$ java -jar arthas-boot.jar
[INFO] JAVA_HOME: /Library/Java/JavaVirtualMachines/jdk1.8.0_351.jdk/Contents/Home/jre
[INFO] arthas-boot version: 3.6.9
[INFO] Found existing java process, please choose one and input the serial number of the process, eg : 1. Then hit ENTER.
* [1]: 12512 com.huangxy.springstudy.SpringStudyApplication
  [2]: 12511 org.jetbrains.jps.cmdline.Launcher
1
2
3
4
5
6
2
3
4
5
6
然后可以选择我们需要 attach 的 java 进程,这里我们选择 1,然后按回车。Arthas 会 attach 到目标进程上,并输出日志:
[INFO] arthas home: /Users/huangxiaoyu/.arthas/lib/3.6.9/arthas
[INFO] Try to attach process 12512
[INFO] Attach process 12512 success.
[INFO] arthas-client connect 127.0.0.1 3658
  ,---.  ,------. ,--------.,--.  ,--.  ,---.   ,---.
 /  O  \ |  .--. ''--.  .--'|  '--'  | /  O  \ '   .-'
|  .-.  ||  '--'.'   |  |   |  .--.  ||  .-.  |`.  `-.
|  | |  ||  |\  \    |  |   |  |  |  ||  | |  |.-'    |
`--' `--'`--' '--'   `--'   `--'  `--'`--' `--'`-----'

wiki       https://arthas.aliyun.com/doc
tutorials  https://arthas.aliyun.com/doc/arthas-tutorials.html
version    3.6.9
main_class com.huangxy.springstudy.SpringStudyApplication
pid        12512
time       2023-07-25 09:14:22
1
2
3
4
5
6
7
8
9
10
11
12
13
14
15
16
2
3
4
5
6
7
8
9
10
11
12
13
14
15
16
到这里,Arthas 已经 attach 到我们的目标进程上了,我们尝试使用dashboad命令,查看进程的信息
$ dashboard
ID   NAME                           GROUP          PRIORITY  STATE     %CPU      DELTA_TIME TIME      INTERRUPT DAEMON
36   DestroyJavaVM                  main           5         RUNNABLE  0.0       0.000      0:1.748   false     false
-1   C1 CompilerThread3             -              -1        -         0.0       0.000      0:0.761   false     true
-1   VM Periodic Task Thread        -              -1        -         0.0       0.000      0:0.237   false     true
24   http-nio-8081-exec-1           main           5         WAITING   0.0       0.000      0:0.098   false     true
-1   VM Thread                      -              -1        -         0.0       0.000      0:0.071   false     true
25   http-nio-8081-exec-2           main           5         WAITING   0.0       0.000      0:0.055   false     true
54   arthas-NettyHttpTelnetBootstra system         5         RUNNABLE  0.0       0.000      0:0.054   false     true
-1   GC task thread#8 (ParallelGC)  -              -1        -         0.0       0.000      0:0.043   false     true
-1   GC task thread#1 (ParallelGC)  -              -1        -         0.0       0.000      0:0.043   false     true
-1   GC task thread#7 (ParallelGC)  -              -1        -         0.0       0.000      0:0.042   false     true
-1   GC task thread#6 (ParallelGC)  -              -1        -         0.0       0.000      0:0.042   false     true
-1   GC task thread#0 (ParallelGC)  -              -1        -         0.0       0.000      0:0.042   false     true
-1   GC task thread#9 (ParallelGC)  -              -1        -         0.0       0.000      0:0.042   false     true
-1   GC task thread#2 (ParallelGC)  -              -1        -         0.0       0.000      0:0.042   false     true
-1   GC task thread#3 (ParallelGC)  -              -1        -         0.0       0.000      0:0.042   false     true
-1   GC task thread#5 (ParallelGC)  -              -1        -         0.0       0.000      0:0.042   false     true
-1   GC task thread#4 (ParallelGC)  -              -1        -         0.0       0.000      0:0.042   false     true
Memory                    used     total    max     usage    GC
heap                      83M      432M     7282M   1.14%    gc.ps_scavenge.count           4
ps_eden_space             72M      212M     2688M   2.69%    gc.ps_scavenge.time(ms)        24
ps_survivor_space         0K       21504K   21504K  0.00%    gc.ps_marksweep.count          2
ps_old_gen                10M      199M     5461M   0.20%    gc.ps_marksweep.time(ms)       61
nonheap                   53M      56M      -1      94.71%
code_cache                6M       7M       240M    2.87%
metaspace                 40M      43M      -1      94.45%
compressed_class_space    5M       5M       1024M   0.53%
direct                    16K      16K      -       100.01%
mapped                    0K       0K       -       0.00%
Runtime
os.name                                                      Mac OS X
os.version                                                   13.0.1
java.version                                                 1.8.0_351
java.home                                                    /Library/Java/JavaVirtualMachines/jdk1.8.0_351.jdk/Contents/
                                                             Home/jre
systemload.average                                           3.80
processors                                                   12
1
2
3
4
5
6
7
8
9
10
11
12
13
14
15
16
17
18
19
20
21
22
23
24
25
26
27
28
29
30
31
32
33
34
35
36
37
38
2
3
4
5
6
7
8
9
10
11
12
13
14
15
16
17
18
19
20
21
22
23
24
25
26
27
28
29
30
31
32
33
34
35
36
37
38
可以看到dashboad命令会展示一个实时的数据面板,列出了我们平时比较关心的数据指标,如内存使用量,gc 状态等
更多命令的使用,可以参考官网的命令列表
# 使用 Trace 命令统计方法耗时
trace命令能主动搜索class-pattern/method-pattern对应的方法调用路径,渲染和统计整个调用链路上的所有性能开销和追踪调用链路
比如下面接口
@RestController
public class HelloController {

    @GetMapping("/test")
    public String test() throws InterruptedException {
       one();
       two();
       return "hello";
    }

    private void two() throws InterruptedException {
        Thread.sleep(20);
        three();
    }

    private void three() throws InterruptedException {
        Thread.sleep(1000);
    }

    private void one() throws InterruptedException {
        Thread.sleep(100);
    }

}
1
2
3
4
5
6
7
8
9
10
11
12
13
14
15
16
17
18
19
20
21
22
23
24
2
3
4
5
6
7
8
9
10
11
12
13
14
15
16
17
18
19
20
21
22
23
24
启动Arthas进程,并 attach 到我们的 springboot 项目上,接着使用trace命令跟踪方法的调用情况
$ trace com.huangxy.springstudy.controller.HelloController test
1
trace方法第一个参数是要 attach 的类的路径,第二个参数是方法名称,接着我们调用一遍接口,就能看到 hello 方法的调用堆栈及其耗时
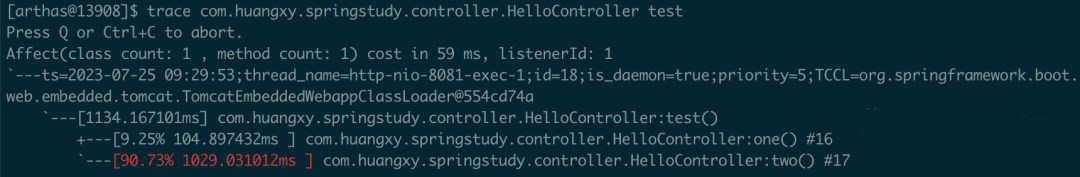
可以看到,这里耗时比较严重的是tow()方法,花了 1029ms,占了 90.73% 的比重
不过需要注意的是,trace 命令只会 trace 匹配到的函数里的子调用,并不会向下 trace 多层,如果需要 trace 多层,可以用正则匹配多个函数,如
$ trace -E com.huangxy.springstudy.controller.HelloController test|two
1

上次更新: 2024/01/30, 15:08:57
- 01
- 保姆级教程 用DeepSeek+飞书,批量写文案、写文章,太高效了06-06
- 03
- 熬夜做PPT?AI一键生成高逼格幻灯片,效率提升10倍!06-06